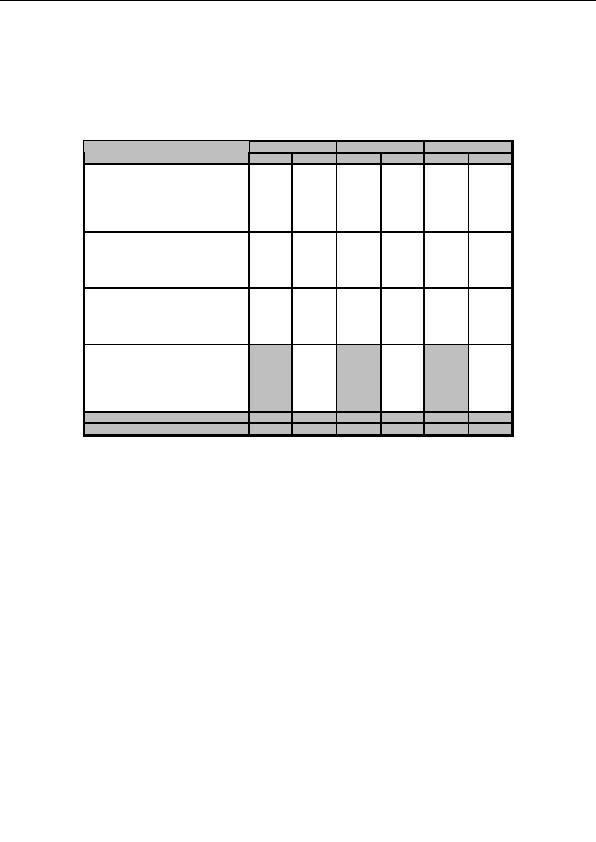
Table 2.1.3
Percentage Distribution of Parent Group Respondents by Background
Characteristics
Male
Female
Total
Background Characteristics
Baseline
Endline
Baseline
Endline
Baseline
Endline
Age group
15 24
14.6
10.7
4.3
6.7
9.1
8.0
25 34
2.4
8.9
21.3
23.3
12.5
18.8
35 44
18.3
25.0
45.7
42.5
33.0
36.9
45 44
36.6
35.7
24.5
22.5
30.1
26.7
55+
28.0
19.6
4.3
5.0
15.3
9.7
Caste/Ethnicity
Brahmin/Chetri/Thakuri
31.7
30.4
30.9
37.5
31.3
35.2
Magar
40.2
26.8
46.8
15.0
43.8
18.8
Rai/Tamang/Gurung
2.1
1.1
Kami/Damai/Sarki
28.0
42.9
20.2
47.5
23.9
46.0
Family members
Less than 5
6.1
5.4
12.8
16.7
9.7
13.1
5 9
73.2
80.4
79.8
75.8
76.7
77.3
10 14
18.3
14.3
7.4
6.7
12.5
9.1
15 and above
2.4
0.8
1.1
0.6
No. of daughters
1
28.6
45.8
40.3
2
50.0
33.3
38.6
3
19.6
19.2
19.3
4
0.8
0.6
5
1.8
0.8
1.1
Total
100.0
100.0
100.0
100.0
100.0
100.0
N
82
56
94
120
176
176
B. Source of Income, Occupational Status and Economic Activities
Adolescent Group
Three fourths (75%) of the adolescent girls cited agriculture (farming) as the main source
of income for their families. The percentage of respondents citing this in the endline
survey as the major source of income was less than those in the baseline survey (75% vs.
87%). Daily wages (getting paid for work on a day to day basis) (14%), overseas
employment (6%), and service industry (3%) were also mentioned as sources of income
in the family. Compared with the baseline survey, daily wages increased from 4% to 14%
as a source of income in the endline survey (Table 2.1.4).
Similar to the baseline survey, the endline survey also showed agricultural labor as the
main activity to support their family (24% vs. 25%). But the other activities such as daily
wages, construction labor, tailoring etc. increased in the endline survey compared with
the baseline (10% to 4%) (Table 2.1.5). The proportion of respondents supporting their
family income increased in the endline survey compared with the baseline survey from
29% to 36%.
13
footer
Our web partners:
Inexpensive
Web Hosting
Java Web Hosting
personal webspace
webspace php
linux webhost
html web templates
DreamweaverQuality Web Templates
PSD Web Templates
cheap webhost
j2ee web Hosting
buy webspace
ftp webspace
adult webspace
frontpage WebHosting
webspace hosting
cheap webhost
Visionwebhosting.net Business web hosting division of Vision Web Hosting Inc.. All rights reserved
cox web hosting